Section 4.1 Graphics formats \(f'(x)\)
A Portable Network Graphics (PNG) image created externally in Sage and then included directly here.
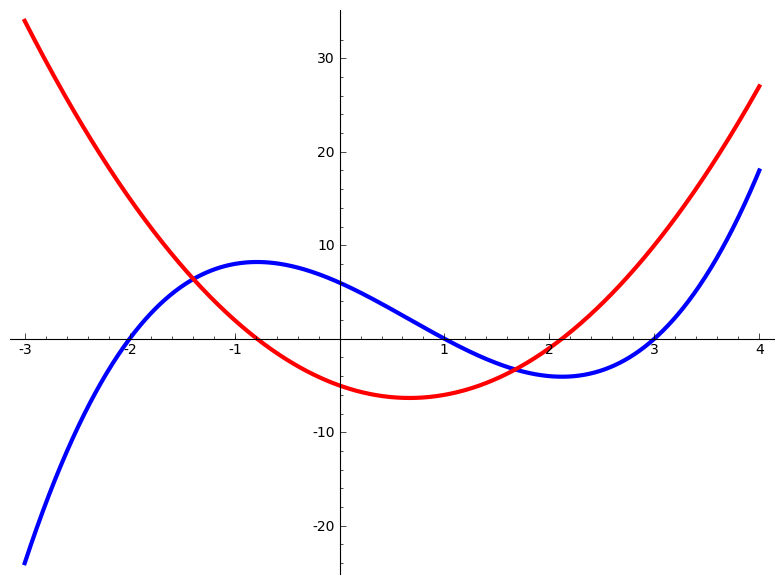
This is a Cartesian plot with a blue curve that enters from the lower left. It crosses the \(x\)-axis at about \(-2\) and climbs to reac a peak at about \(-0.8\) where it flattens out. It continues to the right, now moving downward, and crosses the \(y\)-axis at \(6\text{,}\) and then crossing the \(x\)-axis again at \(1\text{.}\) It bends back upward, returning to quadrant I at \(x=3\text{.}\)
There is also a red curve, a parabola, that enters from the top right. It moves downward, crossing the \(x\)-axis at \(-0.8\) and bottoming out at \(x=0.7\text{.}\) Then it climbs back up crossing the \(x\)-axis into quadrant I at \(x=2.1\text{,}\) and it rises out the upper right of the plot.
Here we drop a small reference to an equation earlier, notably (3.0.1).
A Scalable Vector Graphics (SVG) image created externally in Sage and then included here as a vector image (no file extension given).

A Scalable Vector Graphics (SVG) image described by Sage commands, which is produced by the
pretext script.

